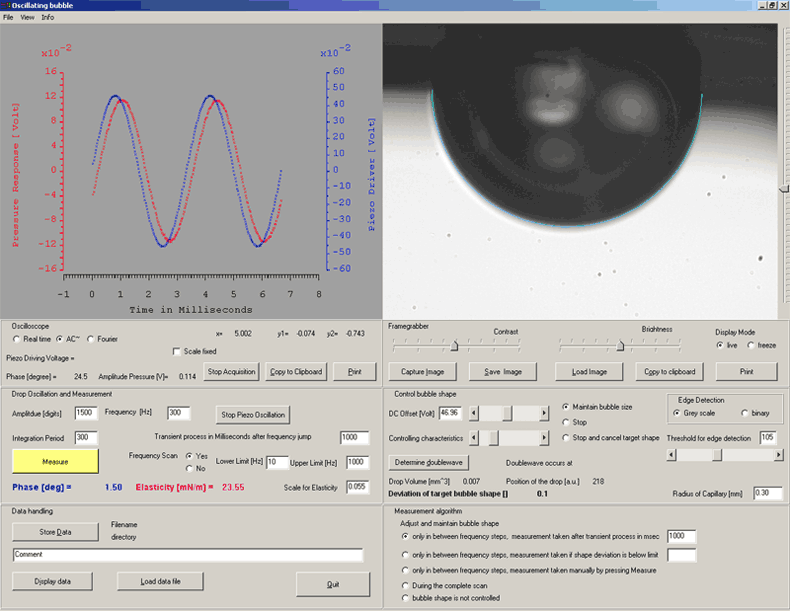
液滴气泡分析仪软件:
The instrument is fully computer controlled and comes with software for data analysis.
The drop is displayed in real time mode. The bubble shape is kep in half squere geometry during the cause of the experiment (greedn line). The piezo compensates thermal drifts to which the chamber is quite sensitive to. The pressure signal (red) and the drivind piezo voltage are also displayed in rela time mode and processed by a Lockin procedure. Both signals are truly harmonic signals. The amplitude of the oscialltion is rather small. It is given by the grey area at the green curve.

View Video (wmv)
The following screenshotvideo shows the formation of the bubble, an oscillation at lower frequency, the contourfinding procedure and the bubble oscillation at a higher frequency.
Several algorithm are implemented to meet the demands of your samples. The user has online control of all parameters. The blue line in the screen dump reflects the piezo position, the red line is the pressure response. Both are truly harmonic signals with a defined phase relation. These signals are processed and evaluated. The complex E module has two components:

The first term accounts for the changes in the surface composition while the second term accounts for the frequency f dependent contribution of the surface dilatational viscosity κ to the E-module. According to the Lucassen-van den Tempel-Hansen model the compositional term levels off into a plateau at higher frequencies. Under these conditions the adsorption layer of the soluble surfactant behaves as a Langmuir layer of an insoluble amphiphile. The second term increases in a linear fashion with the frequency. Both combined contributions reflect the frequency dependence of the module.
| 