液滴气泡分析仪基本原理:
The surface elastic modulus E is defined in analogy to the corresponding bulk quantity as the change in the surface pressure upon a relative area change. Basically, it is a measure for the ability of the system to adjust its surface tension in an instant of stress.
The extension of the frequency range is crucial for the investigation of soluble surfactants. Adsorption layer and bulk are in thermodynamic equilibrium, the surface coverage is determined by the bulk concentration c. The equilibrium is disturbed upon compression or expansion and as a consequence amphiphile must dissolve to the bulk phase or adsorb at the interface to restore the equilibrium coverage. Lets consider two limiting cases: The frequency of the oscillation is much slower than the molecular exchange process so that the mono-layer remains in equilibrium at all times. As a consequence, there is no resistance to the compression or expansion and E vanishes. If the frequency of the oscillation is much higher than the molecular exchange processes, the mono-layer is decoupled from the bulk and behaves similar to an Langmuir layer of an insoluble amphiphile.
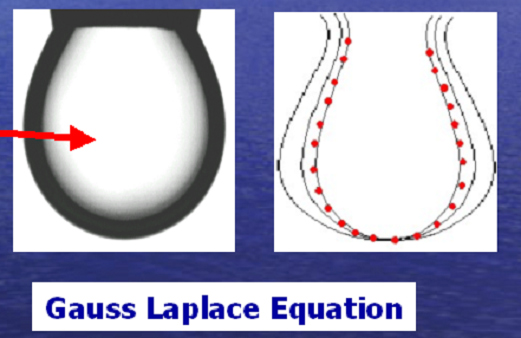
An in a way related technique is the oscillating drop technique. The shape of the drop is determined by the balance between gravity and surface tension. The drop contour analysis leads the surface tension and video analysis leads to the area of the oscillation.
However, as demonstrated by Miller et. al this procedure is limited to a upper frequency limit of 1 Hz. Its use for classical surfactants is rather limited. However, it is the technique of choice for proteins.
Further reading:
M.E. Leser, S. Acquistapace, A. Cagna, A. Makievski, R. Miller
Colloids and Surface A (2005)
2611, (2005), 25
Principle of the measurement
The measurement is based on the oscillating bubble technique as outlined in the following cross-sectional view of the cell:
Advantages:
- Simple set-up
- Separation of volume effects
- Suppression of Maragoni-flow
- Frequency range: 1-1000 Hz
- process can be modelled
The device consists of a metal chamber, a capillary with an inner diameter of about 0.3 mm, a pressure sensor at the bottom of the cell and an imaging system. The chamber is filled with an aqueous surfactant solution such that an air bubble is formed at the tip of the capillary. The bubble is visualized by a video zoom imaging system and automatically adjusted to a half sphere geometry which simplifies the underlying equations.
The bubble is then forced in a well defined oscillation by the piezo. The change of the bubble size modifies the pressure within the chamber which is monitored by a piezo-resistive pressure sensor. The pressure response is sinusoidal with the following contributions:
Δr describes the deviation of the bubble radius r from the halfsphere ro, Δγ denotes the change in the interfacial tension γ and H(f) captures the influence of the hydrodynamics, bulk viscosity and inertia. The frequency dependent hydrodynamic term H(f) contributes at frequencies above 200 Hz. In principle H(f) can be estimated by explicit calculations, but a sound alternative are calibration measurements using a purely elastic surface layer such as decanoic acid.
The system is operated by a computer and a frequency scan requires only a couple of minutes. The piezo motion is controlled by an AD-DA converter which processes also the amplified signal of the pressure sensor. The amplitude of the pressure response and the phase-shift between piezo oscillation and pressure response are evaluated via a phase sensitive lockin detection scheme. The amplitude of the pressure response is proportional to the magnitude of the complex surface dilatational modulus E, while the phase-shift yields the imaginary part of the modulus, in other words the surface dilatational modulus. Bubble and capillary are imaged by a video zoom imaging module, digitized and processed in a personal computer. The video system is crucial for maintaining the bubblesize and to compensate thermal drifts in the chamber.
The implemented design gives access to the frequency range of 1-1000 Hz as a major difference to all other commercial drop devices which rely on the analysis of the drop contour. The frequency range around 100-400 Hz is of particular importance for aqueous surfactant solution. The design of the cell suppresses many unwanted features such as Maragoni flow. Investigations with a high speed camera reveal that the three phase contact line at the capillary remains constant at all frequencies. Furthermore the studies reveal that the drop oscillates in the zero order mode even at frequencies around 1000 Hz.
|  公司新闻
公司新闻